
Many investors, especially small investors, are more comfortable to operate in markets at times when the stock market is in an upward movement. Optimism and positive projection are often greatly influence in decision-making, and that is why it is also important to identify whether we are in a general bullish trend.
Again we will analyze the main indicators to identify and meet the overall situation in the markets. We must clarify that we are analyzing the global economic situation. For decision making at the entrance or exit of a specific asset, is necessary to analyze that security price and not just based on the analysis of global indicators.
During the period between 2004 and 2007, widespread prosperity in the markets was experienced. The financial bubble is nothing more than a movement of prolonged speculation and an optimistic market behavior. It is here that after a bullish period, there comes a time when investors buy overpriced to sell at an even higher price values, and this behavior makes the markets collapse.
Let's see how to identify a bullish moment to use it. We started analyzing the S & P 500, the most important indicator of the US market.
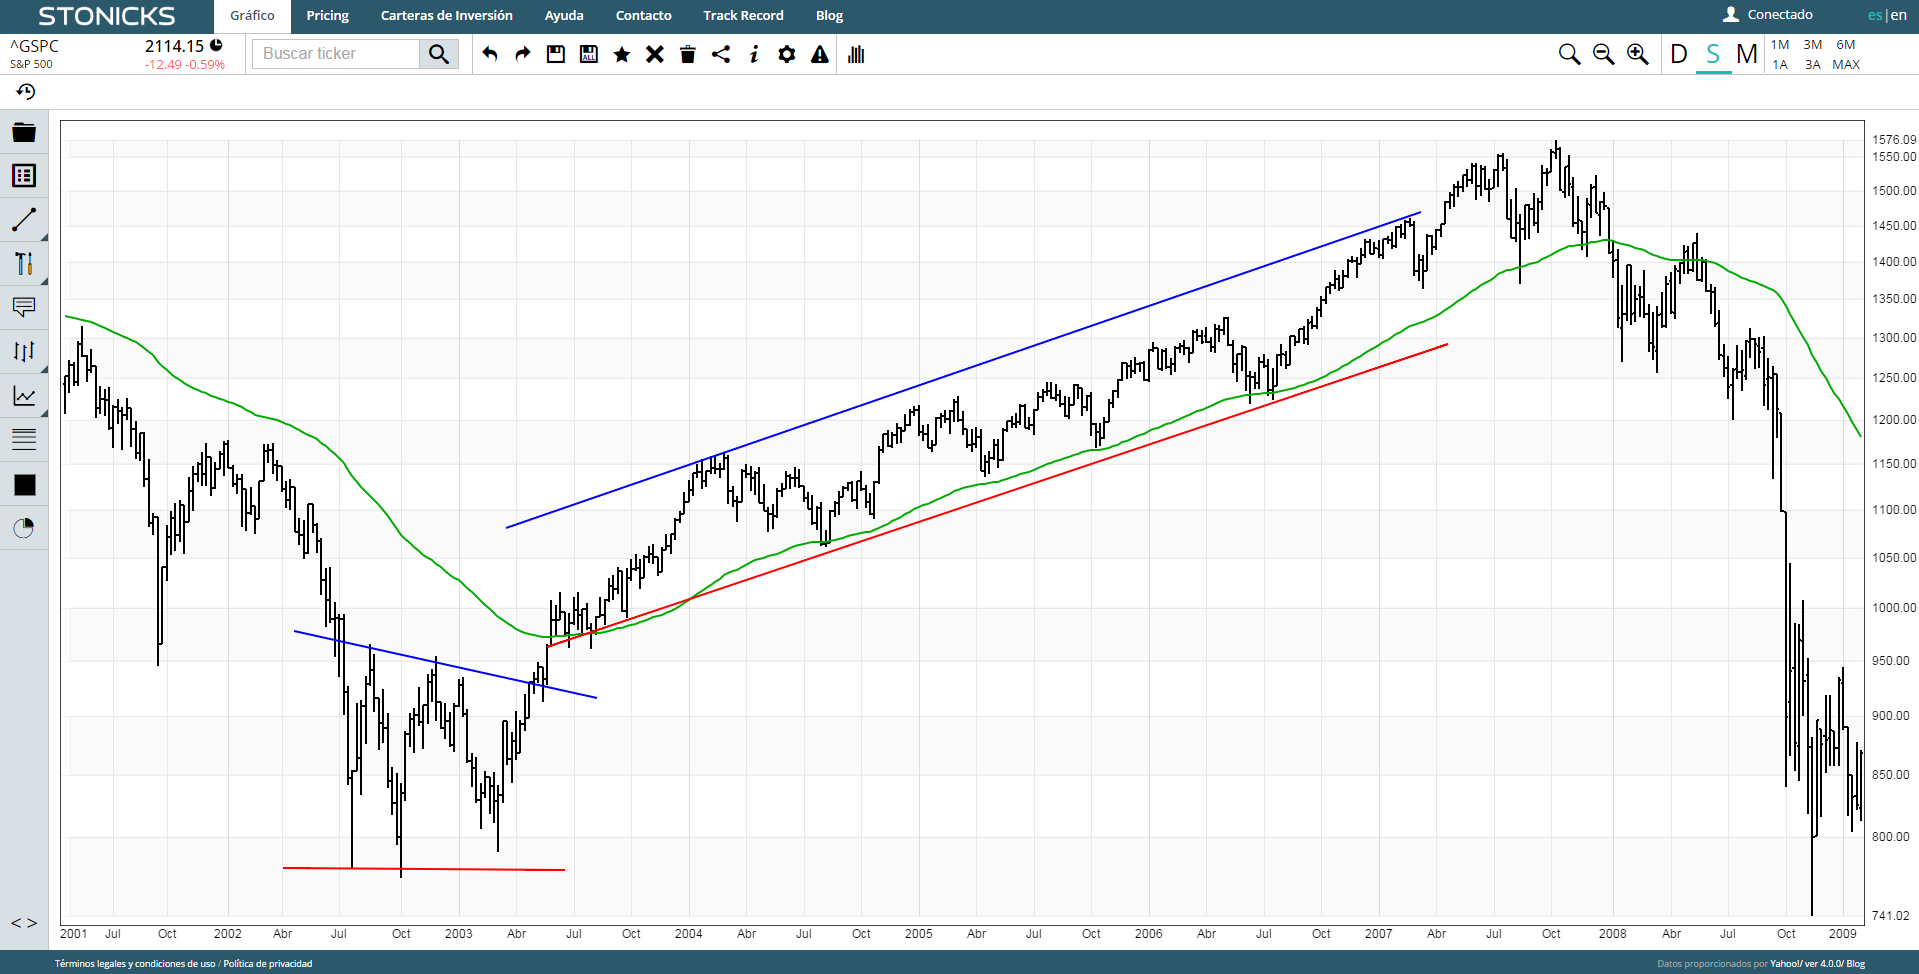
During the period between late 2002 and early 2003 we can see how the American index performs a bearish movement and leaves behind a triple bottom pattern. The downward movement can not penetrate the support of the figure, which can already be a first sign of turnaround. We also see as the moving average is now below the price, so it can be a confirmation of uptrend. As a last sign, we see that the further bullish movement creates a channel from 2004 to 2007 clearly showing the consolidated upward move.
Consider the behavior of the markets in the German DAX index. You can consider this index as a good reference indicator of the economy in Europe.
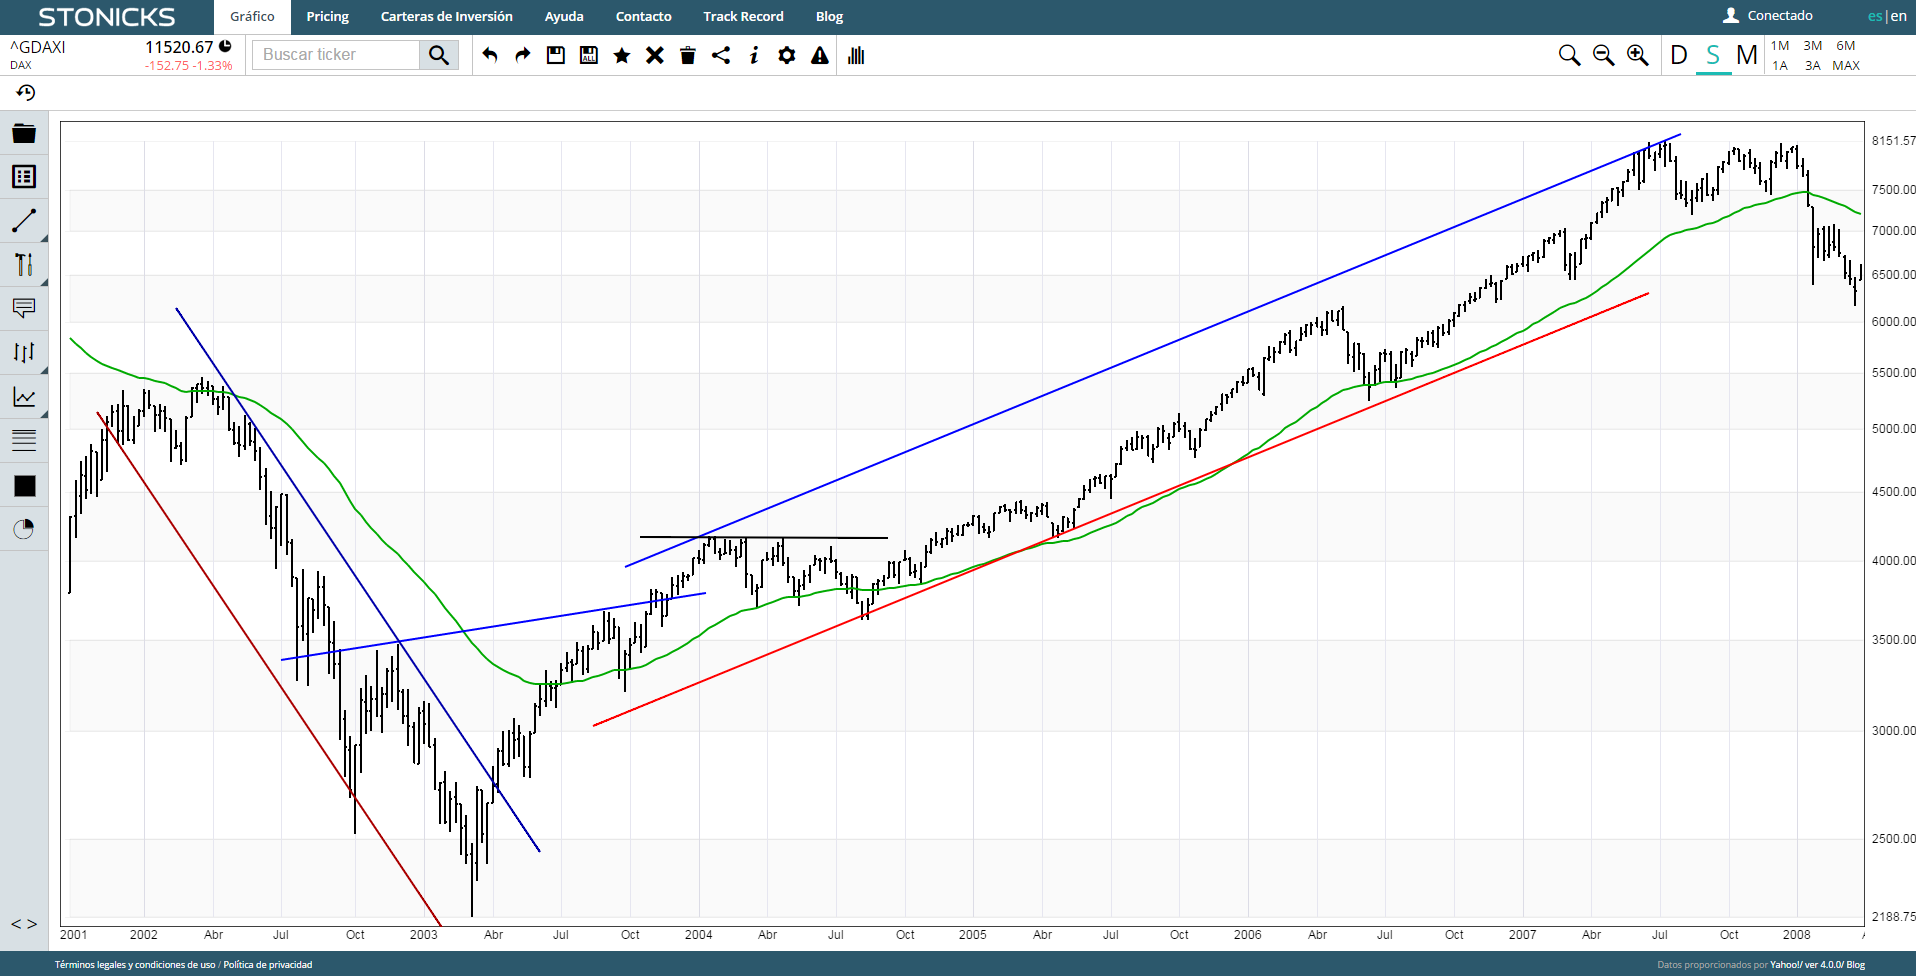
Again it looks like , after a downward movement , over 2003, the security forms an inverse head and shoulders pattern which is a first sign of change in trend, and is confirmed by moving average being below the price. It also looks like a small triple top pattern is formed and the security price reaches and cross the resistance created by this small pattern , which would add another sign of confirmed upward movement. After this, you can see a consolidated bullish channel.
Finally , let us see the Chinese flag HSI , as it can be a good reference for the Asian market.
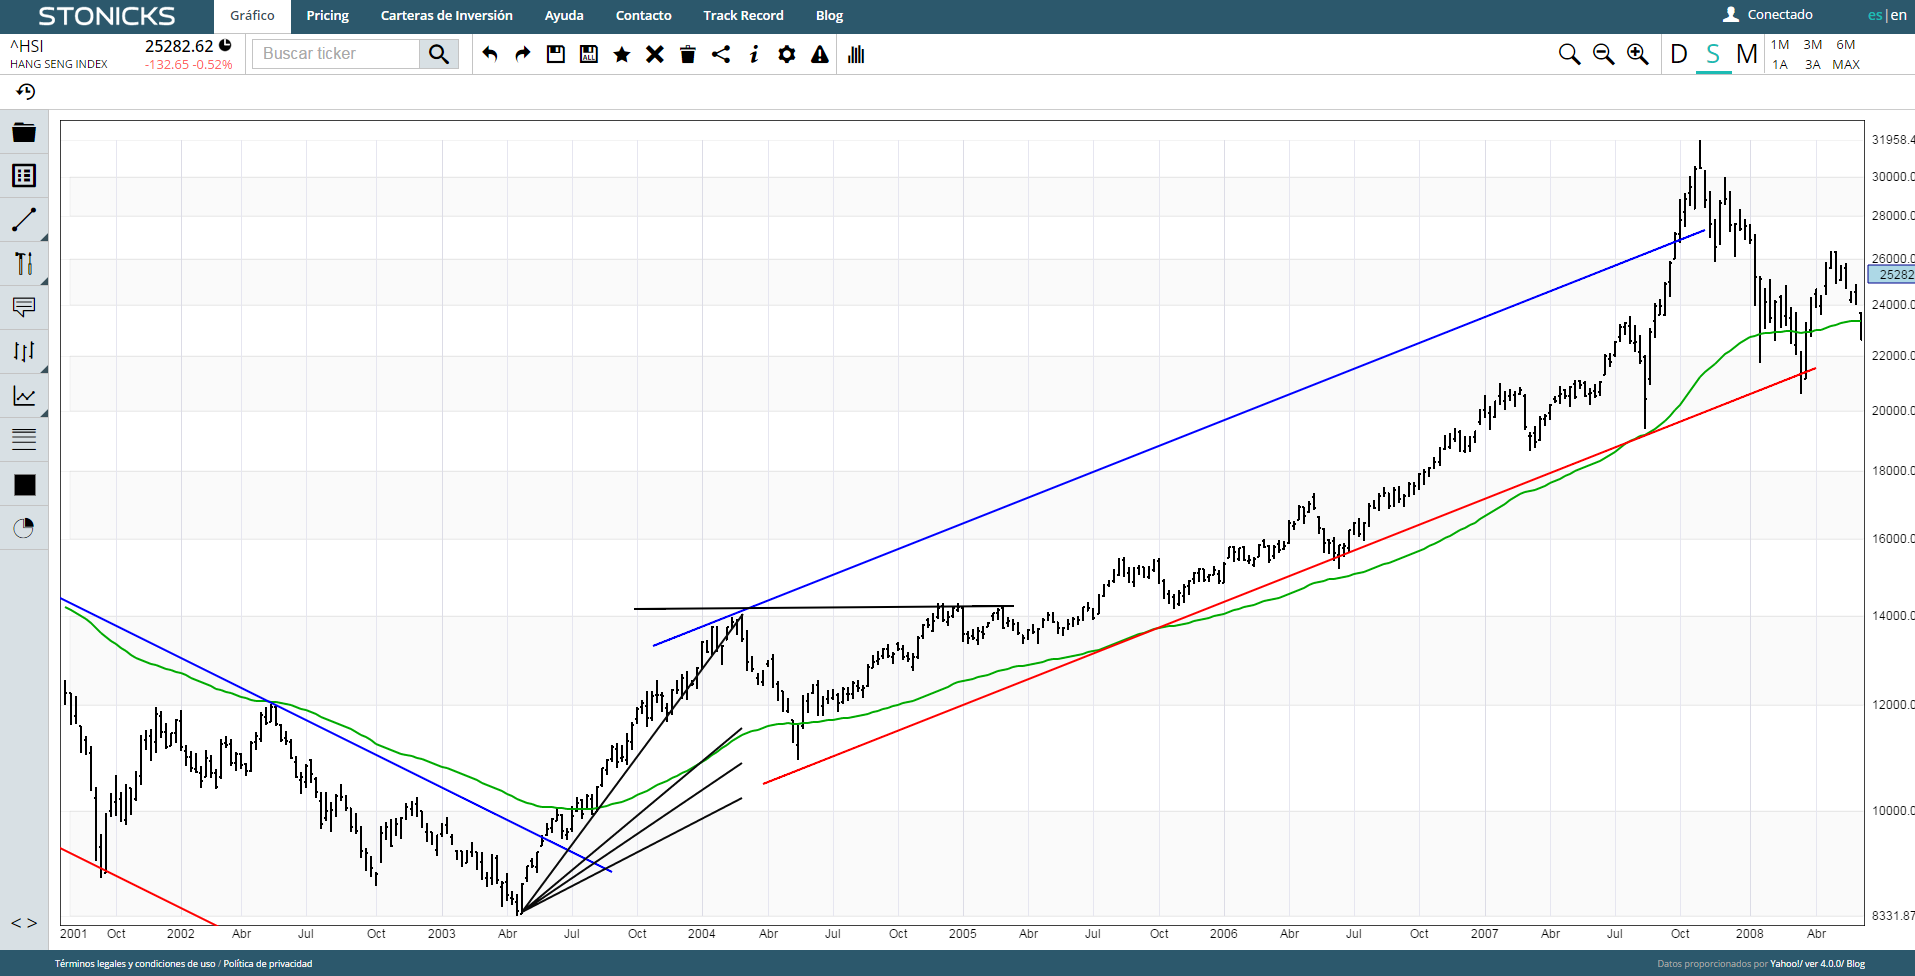
In this case, we see the bearish channel prior to 2003 where the moving average is above the price. It is between April and October 2003 when the first signs of turnaround occur. The price breaks the resistance created by the bearish channel, the moving average becomes below the value of the index, and looks like after the first upward movement, known as pullback correction occurs. The next upward move, is able to overcome previous resistance, so we have an uptrend over one year.
All these signals can be taken as a compass pointing the general direction of the market. This does not mean that all assets will be bullish, but it helps us in decision making. Given a generally rising market, the ideal and simplest, is looking to invest assets follow the overall market movement. If we operate in a period when markets moves downward, it is more difficult to trade in rising stocks, so it would be advisable trading in bearish assets. Therefore, we can conclude that before deciding if we trade in a bullish asset, or a bearish asset, it is highly recommended to scan the main indicators to know what the overall market movement.

Comments (6)
PkYMBhQDfLTNs
December 16, 2023, 8:52 pm -PkYMBhQDfLTNs
December 16, 2023, 8:52 pm -TlLBZrwJyR
January 31, 2024, 3:59 pm -TlLBZrwJyR
January 31, 2024, 3:59 pm -EqBCzhvr
March 9, 2024, 7:55 pm -EqBCzhvr
March 9, 2024, 7:55 pm -Leave a comment.