
Is technical analysisi a foolproof method? Of course not, but it can help in decision-making. With the necessary preparation, making proper use of indicators and knowing how to interpret the signals that the market is leaving behind, we can be more prepared for an important events.
The 2007-2008 crisis was global, affecting all markets. In an event like that, an investor can lose all his capital within a year if he is not prepared to face it, or if he has not the necessary tools to react in time. You can give many explanation for this great recession; economic deregulation, high prices of raw materials due to high global inflation, overvaluation of the product, global fool and energy crisis, and market confidence crisis. Today it is virtually imposible to keep all of these factors and take then into account in decision-making.
In technical analysis it is considered that the price already includes all the facts that may affect the markets. Therefore a good way to understand the behavior if the markets is to analyze the major indicators. Let´s see a few examples of the application of technical analysis indicators during the period of the crisis.
We started with the S&P500. The Standard & Poor´s 500 is the most representative of the real situation of the North American market stock index. This index is based on 500 large companies with shares traded on the NYSE or NASDAQ stock exchanges. Lets see the behavior that followed this index over from 2006 to 2010.
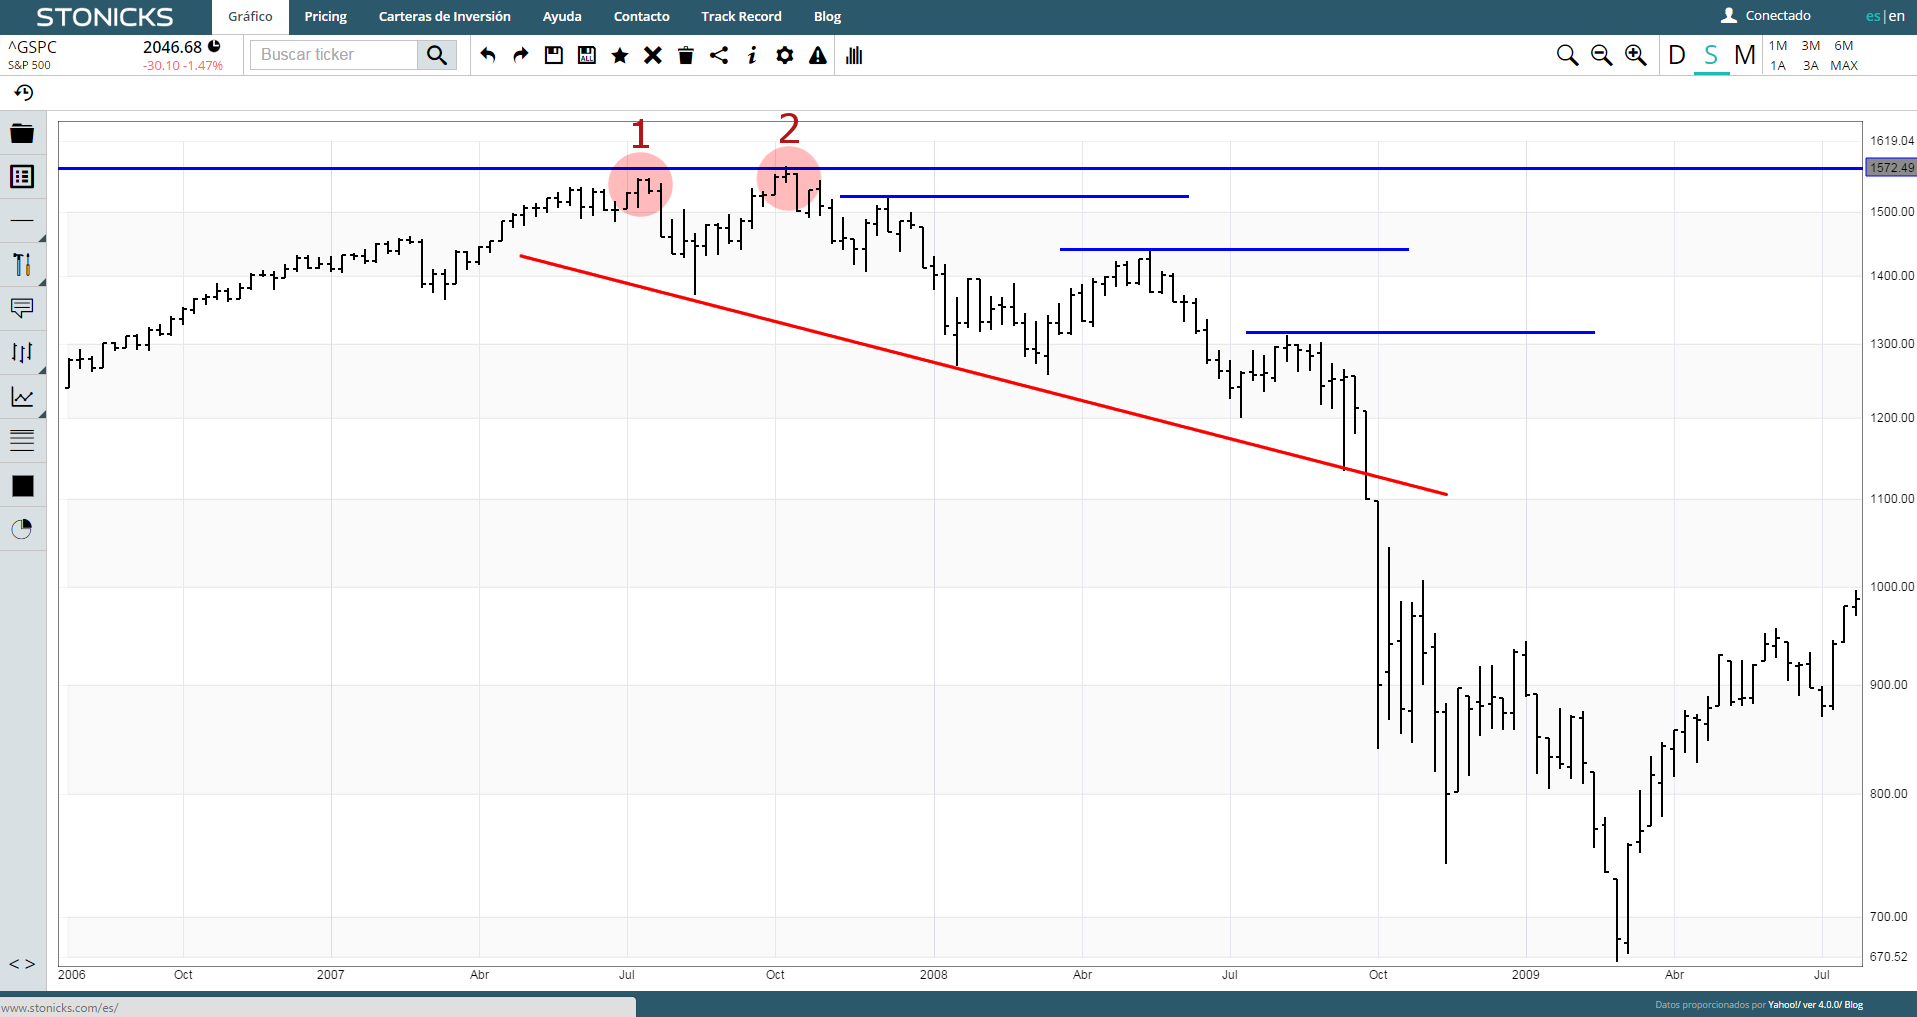
As we se in the picture, in point 1 the S&P500 peaked a maximum, and in point 2 the price bounced unable to overcome the resistance. After this, you can see that in the following months the price is marking maximums in a downward movement. We see how it builds up a primary downtrend. Knowing interpret these signals and helping other indicators, we can be better prepared in making decisions on our investments. As extra help, we can analyze the chart of the S&P500 in a more global way, to see their behavior over time.
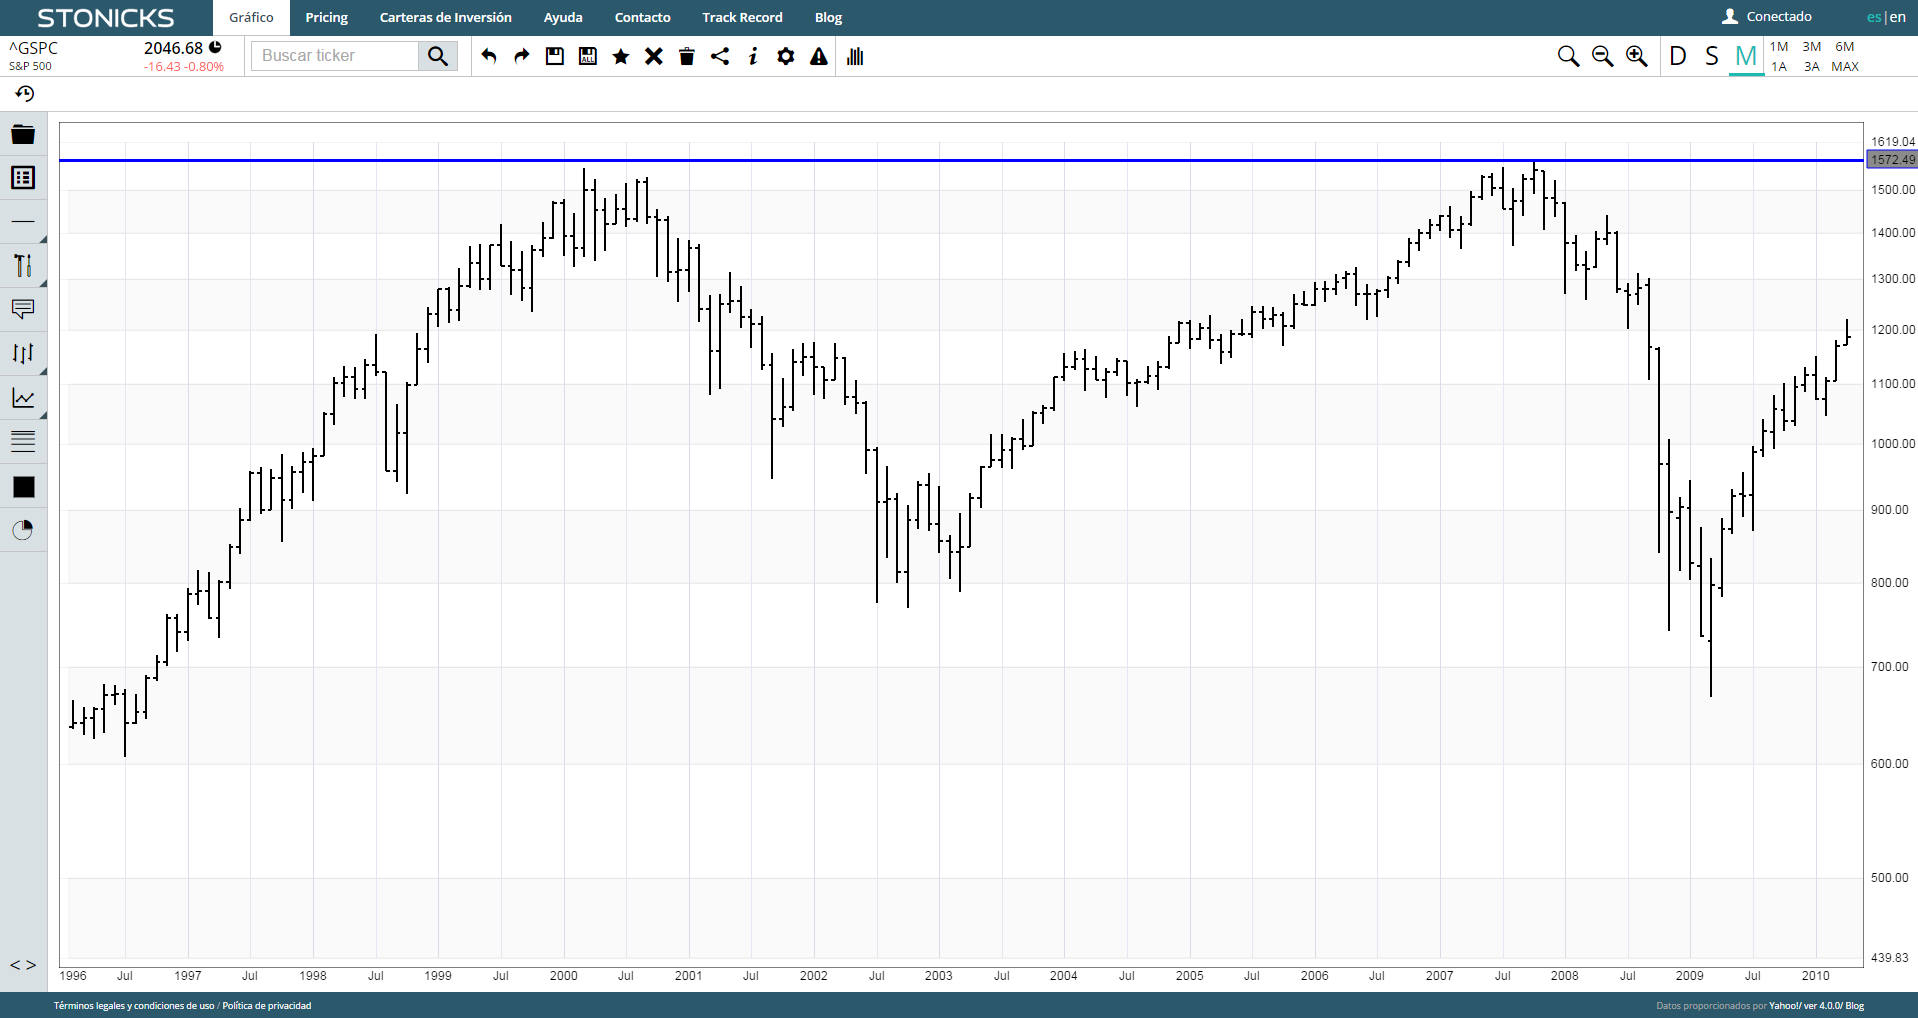
Here we see the indicator since 1997. As can be seen, in October 2007 it approaches the resistance created in July 2000 without being able to overcome it. Technical analysis studies such movements, and the meaning if these signals. All these signs may anticipate a bearish movement.
Lets see the crisis using another index; the DAX. The DAX index is the bes known index of thr German stock exchange. It consists on thr top 30 listed companies in the Frankfurt Stock Exchange. In this indicator, no value can have greater weight to 20%.
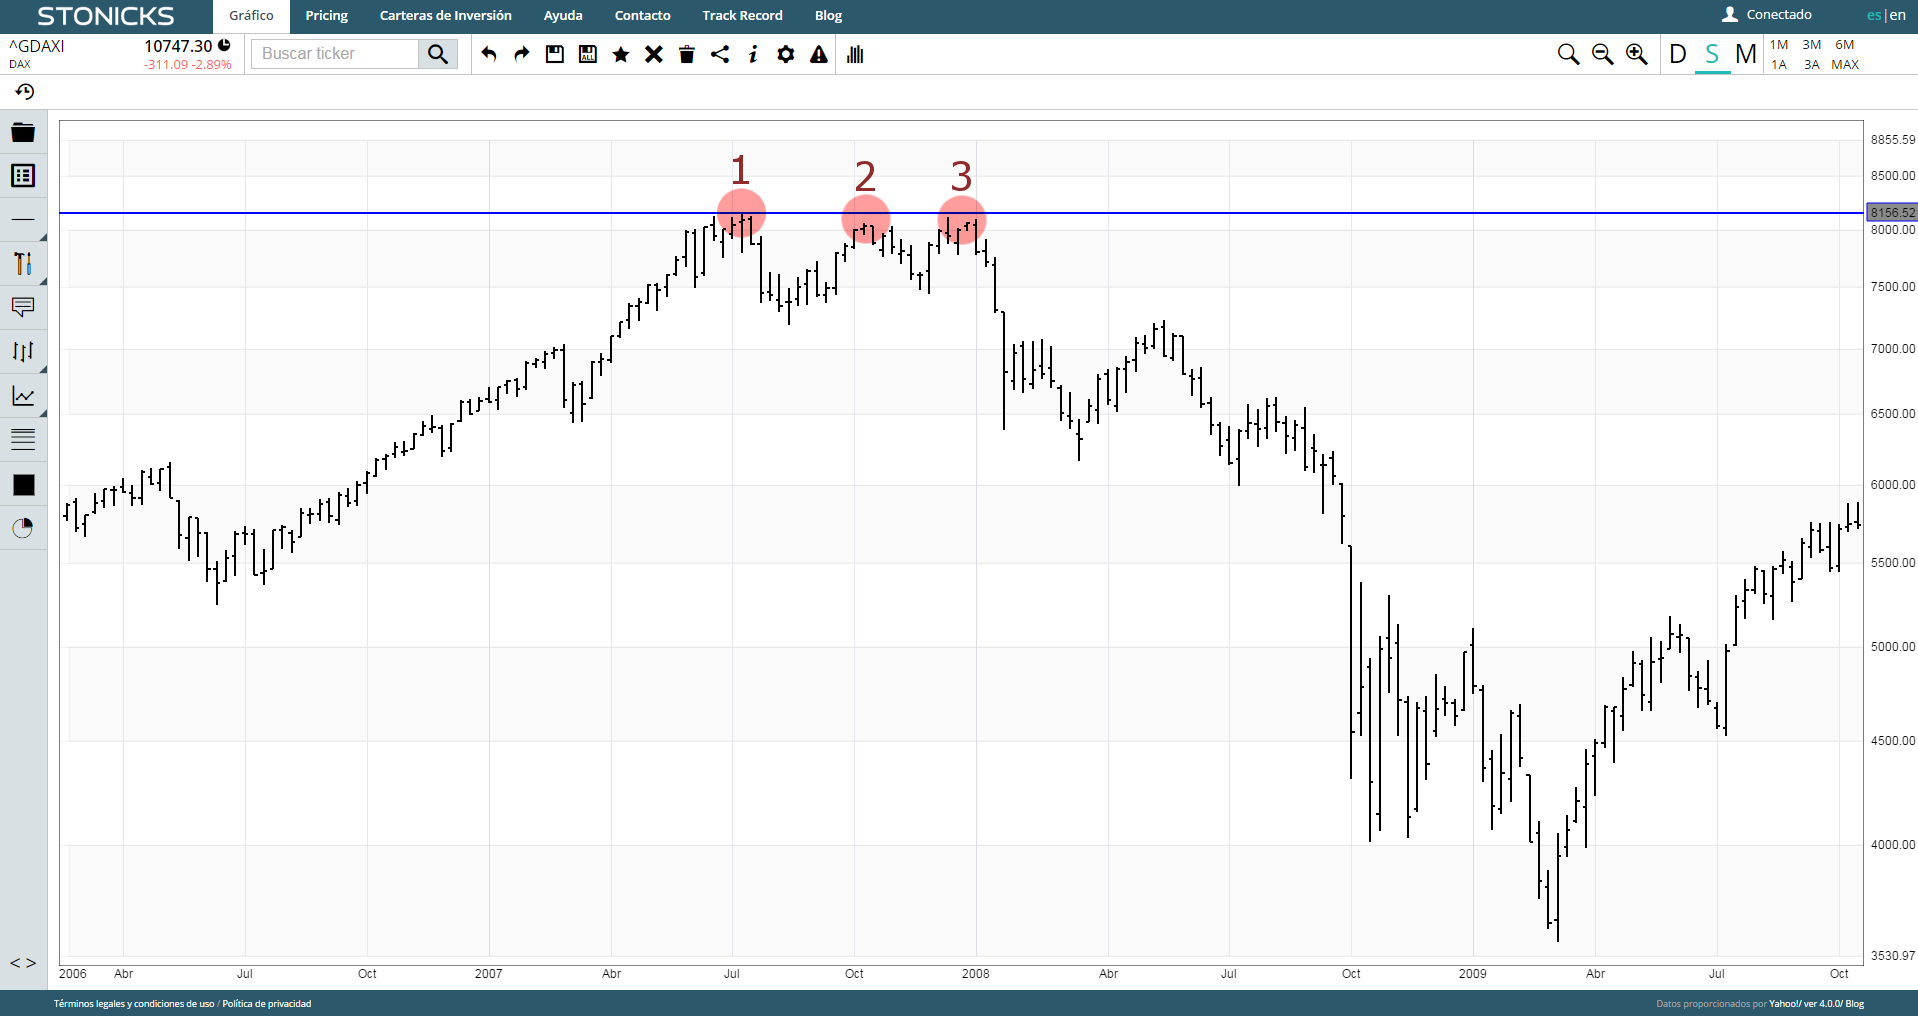
Here again we see how in point 1 a resistance is created. In points 2 and 3, the price is not able to avercome this level. Again we see the following downward movement lasts for more than 3 months. Analyzing these graphs with appropiate indicators and tending all these signs in mind, we have to be prepared for a possible bearish movement.
Let´s see the situation from the Chinese index HSI. The HSI index is the leading Chinese bursatil index of Hong Kong. It is used to record and monitor daily changes of the largest companies on the Hong Kong stock market.
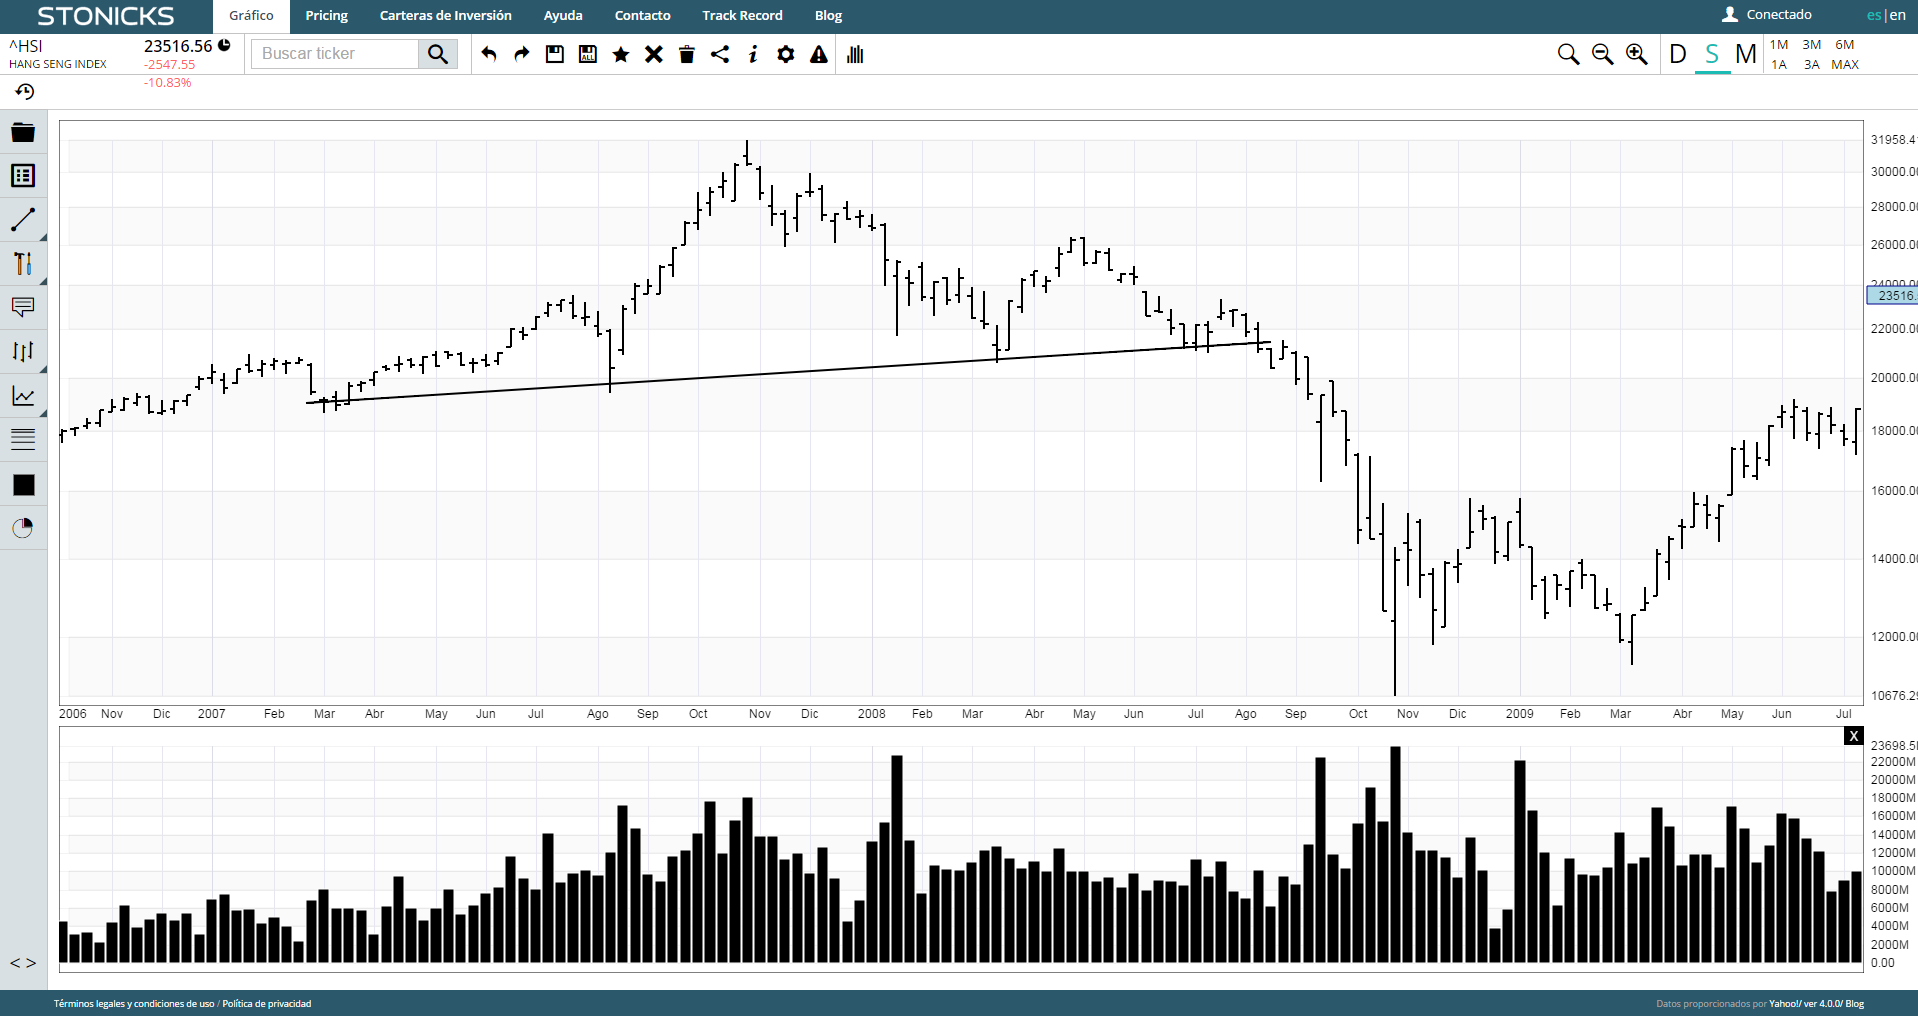
In this index you can see how it has formed a head and shoulder pattern. We have to analyze this type of figure and its importance in the market and its futures movements. For now, it suffices to say that this pattern anticipated a bearish movement, and indeed fulfilled the objetive price of this figure.
Now we have seen the graphs of various market indicators we can see how using technical analysis, and a relevant preparation, an investor or trader can anticipate these movements. In this case, bear market signals were seen in the most important indicators. A bearish signal action can alert us about an key moment to enter the market or to exit from the market. But if the signals are repeated in several important indicators, we must take them into account for markets movements on a global basis. With this, we can say that technical analysisi is a tool that allows us to have a vision of past market movements and possible future moves.

Comments (4)
TlLBZrwJyR
January 31, 2024, 3:58 pm -TlLBZrwJyR
January 31, 2024, 3:58 pm -EqBCzhvr
March 9, 2024, 7:56 pm -EqBCzhvr
March 9, 2024, 7:56 pm -Leave a comment.